Title: Formalizing Design Rules: elements that create a Story from a Plot
Author: Alia
Last modified $Date: 2006/03/13 13:36:19 $
Version: 2.2
(Freezed)

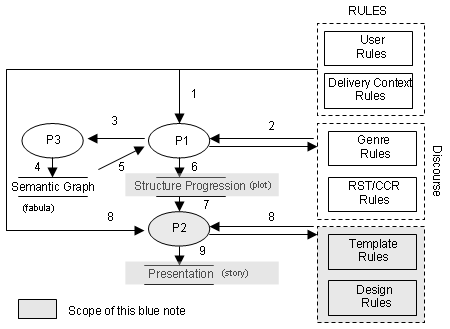
Figure 1. Scope of this blue note in grey color. (more discussion about this diagram can be found in sd03_overview.html)
Disclaimer: This graph might might not be complete, general nor correct. Never the less, it's the way I see the puzzles related together. For the time being readers can ignore this graph.
2.
Content
3. Related works
4. Structure Progression
4.1. Choosing the plot: CCR, RST or other?
4.2. Basic elements of a plot.
4.3. Example of an E-culture plot
5. Presentation
5.1. Basic elements of a story
5.2. Example of an E-culture story
6. From Plot to Story
6.1. Assuming we have the perfect plot in RST form.
How do we perfectly translate it to story?
6.2. Is there a one-to-one mapping from plot (structure progression) to story
(presentation)?
7. E-culture context: Are all relationships as described on RST theory necessary
to be presented in Eculture domain?
8. Reference.
3. Related Works:
(See reference list at the end of this bluenote)
I am using the term plot and story a lot in this bluenote. The meaning of this term is defined in Ref.6. (Jacco's bluenote on discourse). Basically plot=structure progression and story= presentation.
Ref 1. and Ref 2. Provides an excellent discussion on the reverse engineering process of getting back RST structure from a presentation. They demonstrated that a good layout structure indeed corresponds to a good RST structure. However, there is no explicit discussion in this paper about doing the forward process of getting a presentation out of an RST structure. Although this paper mention several times about graphical elements, no discussion about what are the design rules and how to use these rules if we have an RST structure. Surprisingly enough, somewhere in the paper there is one sentence in Ref 1. mentioning the "importance score" of a nucleus to impose visual weight. Unfortunately, Bateman did not elaborate any further not discuss how to assign importance scores and how to use them. Moreover, these papers did not make any suggestion on how to translate relationships (between information) to visual graphical elements.
Ref 3. trys to make a presentation out of a discourse structure. Instead of using RST, Mancini uses Cognitive Coherence Relations (CCR). CCR is not much about hierarchy as it is about relationships. The relationships listed on CCR are quite similar to relationship at RST. Mancini tried to translate these relationships into graphical form. Mancini gives hints on which design rules applies to which relationship. However, she did not say how she came to deciding the graphical form.
Ref 5. Tries to translate RST for multinucleus relationships only. The advantage is that it makes things simpler. The disadvantage is the paper did not discus how to translate nucleus-satellite relationships Table 4. which happens very frequently. I do wonder if it is the case that the extensive relationships in table 4 can be presented in the same visual manner (same communicative device). I feel that textual language is richer then visual language but visual language is non verbal and my previous research showed me that non verbal communication and textual language can not be exactly mapped 1-to-1(but perhaps this is not the case?). Ref 4. did not based its research on RST theory, so I was not sure on how to make a connection between this research and the problem which I am trying to solve.
Ref 7.8.9 gives design guidelines which will be the basis of the design rules discussed throughout this bluenote.
This blue note will use research from Ref 1. and Ref 3. and try to take it to the next step: how to translate RST structure (plot) to Layout structure (story) including translating relationships between information to a visual graphical form, managing conflicts and making decision based on importance score of every rule.
4. Structure Progression4. 2. Basic Elements of Plot
| No: | Structured Progression (SP) | Meaning |
| 1. | Information unit (IU) | Information unit is basically a
node on the plot hierarchy. Information unit can be terminal
or non-terminal. An information unit is non-terminal if it is a
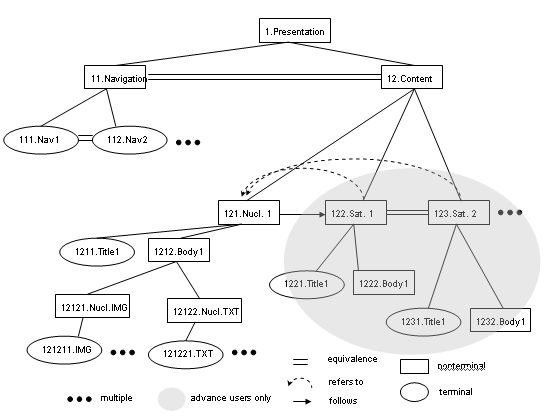
parent of one or more information unit. Every information unit has a set of property. Information unit is a direct analogy of presentation unit (see table 3). Every presentation unit is translated from an information unit. An information unit is terminal when there it is not a parent to any child node(s) and vice versa, an information unit is non-terminal if it is a parent of other node(s). See firgure 1 for examples. |
| 2. | IU Property | IU Properties are attributes of the information unit.
An example of an
information unit property are:
- Importance level |
| 3. | Cluster | Information unit have the same cluster if the information unit have the same property or the same parent. Clustering by the same parent is also called building hierarchy. |
| 4. | (SP) Hierarchy | Non-terminal and terminal information unit build up a hierarchy (see figure 1). Child node with the same parent is clustered in one sub tree hierarchy. Hierarchy can also be regarded as "is part of" relationship. |
| 5. | SP Relationship | Relationship describes what kind of connection does
the information unit have with each other.
See table 3 and 4 from RST relationship types. (Ref 1) |
Table 1. Basic elements of a plot
4.3. Example of Eculture plot

Figure 1. Example of a Plot from Eculture presentation (see alia_sd01.html)
A presentation consists of a lot of terminal and non-terminal element building a hierarchical structure. Each sibling relates to each other in either a multi-nuclear relationship or nucleus-satellite relationship.
5. Presentation
5.1. Basic elements of a story
| No | Presentation | Meaning |
| 1 | Presentation Unit (Blocks) | A presentation unit is a (visual) element that has occupies an area and has (invisible or visible) boundaries. (note: for the time being only visual time independent presentation will be considered). |
| 2. | (Blocks) Property | Blocks property are attributes of a presentation unit. There are two types of property: high level property and low level property. High level property is an analog of IU property. The properties describe the desired goal of the presentation. Low level property is a description of style to achieve the high level property goals. high level property e.g. based on attention level: "high", "medium", "low"based on hierarchy: "main", "a-part-of" based on presentation element type: "heading1", "heading2","body", "link" Attention level is the salient-ness property of a presentation unit low level property e.g. based on style: color, size, position, spacing, margins, border, background,
|
| 3. | Visual grouping (Ref 10.) | presentation units have the same visual grouping if they have the same property |
| 4. | Visual hierarchy (Ref 7.) | Visual hierarchy is a collection of presentation units in a "a-part-of" relationship. Two types of visual hierarchy: inwards (nesting) and outwards (menu like) |
| 5. | Visual relationship | association of visual units with each other. |
Table 2. Basic elements of a story
5.2. Example of an Eculture story

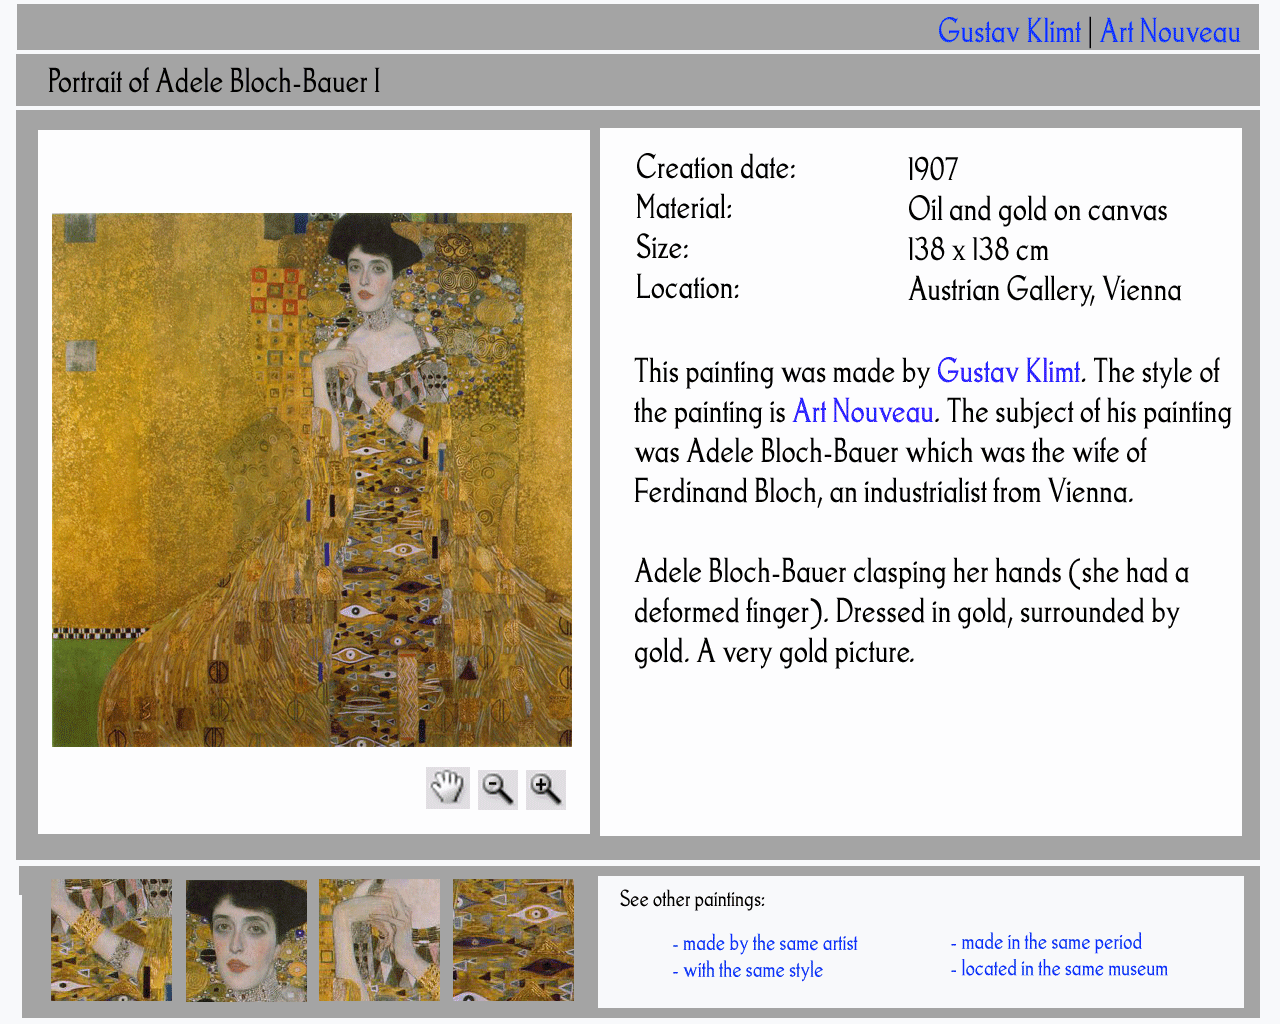
Figure 2. Eculture presentation example (taken from alia_sd01.html)
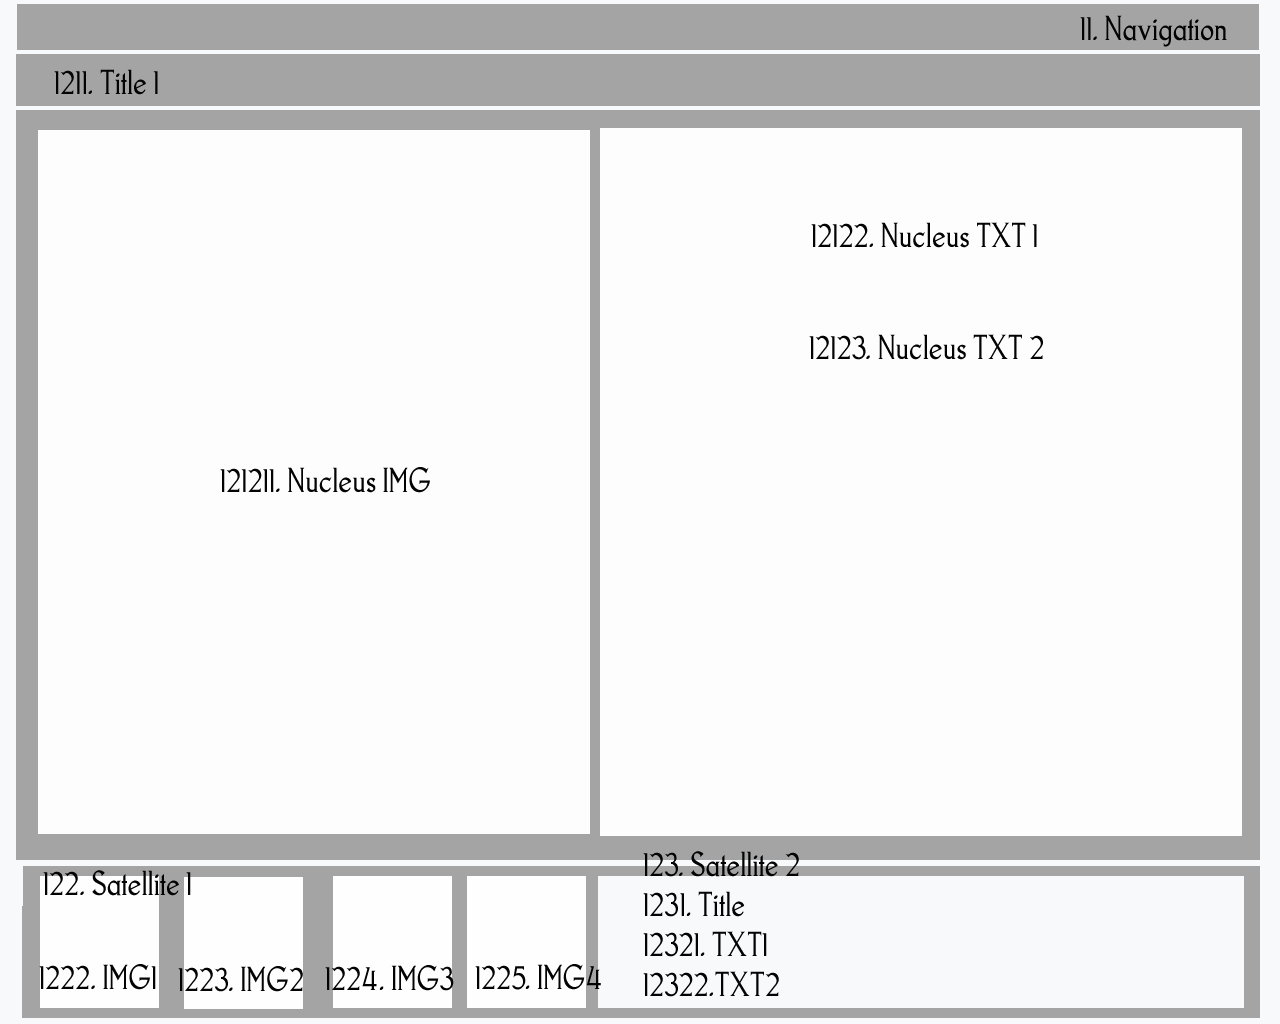
A Presentation consists of many (visible and non visible) blocks which are nested on top of each other. The blocks which are on the lower layer acts as a container which nest the upper layer blocks. At the highest layers are the most visible ones where all the hypermedia are located.
Eculture layout (story) consists of:6. From Plot to Story
6.1. Assuming we have the plot in RST form. How do we translate it to a story?
| Structure Progression | to | Presentation |
 |
► |
 |
Conversion from plot to story:
| No | Structure Progression |
► |
Presentation |
| 1 | Information unit | Block (see step 0) | |
| 2. | Information Property - Importance level - Type of function |
Presentation Property (see step 3 and table 4) - Attention level - presentation element type |
|
| 3. | Information Cluster | Presentation Group | |
| 4. | Hierarchy | Visual hierarchy (see step 1) - inwards (nesting) - outwards (menu like) |
|
| 5. | Relationship -multinuclear relationship -nuclear-satellite relationship |
Visual relationship (section 3.2) - order, group and distinction - label of relationship, group, distinction |
Table 3. table of conversion from plot to story
The Conversion Process:
Step 0. Every Information Unit is one Block
Step 1. Translate the hierarchy into visual hierarchy (eg. nesting), higher hierarchy are placed
first thus located in the lower layer of the nesting scheme. Put the blocks on
the visual hierarchy spaces corresponding to the information unit's
position on the structure progression hierarchy.
Step 2. Translate every relationship into visual relationship. Equal
multi-nuclear relationships are placed in an order. Nuclear-satellite
relationships are translated to the corresponding visual relationship (this is
discussed further in section 3.2 )
Step 3. Translate information property (importance and cluster) to
presentation property (attention and group)
Step 4. Assigning constraints to the presentation property and visual
relationship. See table
4 below.
| No: | Constraint | Group | Order | Type Similarity | Attention | Distinction |
| 1 | Position | |||||
| same column | ++ | |||||
| same row | ++ | |||||
| Closeness | +++ | |||||
| Same area | +++ | |||||
| Same layer | + | ++ | ||||
| Before / after | - | +++ | ||||
| Overlap | ++ | ++ | ||||
| 2 | Color | |||||
| - same color | ++ | +++ | -- | |||
| - harmonious color | + | + | ||||
| - contrast color | ++ | ++ | ||||
| - Negative space | +++ | |||||
| 3 | Style | |||||
| same boundary / texture / background | ++ | - | +++ | |||
| Contrast in background | +++ | |||||
| same (font) style | +++ | |||||
| Contrast in (font) style | +++ | -- | ||||
| Alignment | ++ | |||||
| same shape | + | - | +++ | |||
| same marked | - | +++ | ||||
| 4 | Size | |||||
| same | ||||||
| different size | ++ | --- (never use size for distinction) |
Table 3. Translating high level visual properties to low level visual properties. Using graphical and typographical resources for the different layout goals - inspired by [Ref 3.]
Important: from Table 4, it is understood that at there is five kinds of property which can be represented by position, color, style, and size constraints, they are: group, order, similarity, distinction, attention.
6.2. Translating relationship to visual relationship.
Does every type of relationship in RST needs be translated in visual presentation?
RST relationship is very rich and intended to define word relationship (Table 5). I do not have any proof at the time being but I will make a bold claim which I need to prove later on:
"I believe that presentation visual relationship is and should be more simpler then the RST word relationship and can be done in various visual way. There is no universally accepted convention to translate RST word relationship to visual relationship. Eventhough visual relationship is simpler, just like synonyms in word relationship, there can be more then one way to express the same visual relationship"
Clara Mancini (Ref 3.) tried to translate her own (selected) CCR relationship to visual relationship and even did an evaluation on the users understanding of the CCR relationship behind the visual relationship. But IMHO you can teach any user to understand the meaning of a visual relationship or cue, it does not mean it will be a norm nor will people feel the need to use this cue to understand the presentation as a whole.
Interesting fact: unlike textual presentation where a user need to read a full sentence or paragraph to get the idea behind a textual presentation, visual presentation is different, to put it bluntly: people SCAN and NOT READ [Ref 7]. Thus, unlike text presentation, the relationship keywords to present the relationship in table 4 (e.g. and, or, moreover, etc.) are not important in visual relationship. This might be a daring conclusion and I need to prove this statement somehow, but my assumption is that visual relationship is simpler then its textual counterparts.
|
Nuclear-satellite relationship |
Multi-nuclear relationship |
|
Antithesis |
Contrast |
|
Background |
Joint |
|
Circumstance |
List |
|
Concession |
Sequence |
|
Condition |
|
|
Elaboration |
|
|
Enablement |
|
|
Evaluation |
|
|
Evidence |
|
|
Interpretation |
|
|
Justify |
|
|
Motivation |
|
|
Non-volitional Cause |
|
|
Non-volitional Result |
|
|
Otherwise (anti conditional) |
|
|
Purpose |
|
|
Restatement |
|
|
Solutionhood |
|
|
Summary |
|
|
Volitional Cause |
|
|
Volitional Result |
Table 4. RST list of relationship type.
7. Eculture context: are all relationships as described on RST
neccessary to be presented for the Eculture domain.
Short answer: no.
Long answer: only several relationships are meaningfull for Eculture. As
presented from figure 1. relationships which exist there are:
1. Elaboration: blocks that clarifies other blocks. eg. small parts of
images that elaborates larger images.
2. Enablement: shortcuts to magnify and move artwork images. eg. icons
3. List: hyperlinks to connect to other resources.
How did I translate this this relationship in the mockup figure 2? To my own surprise, I just present them as a sequence of blocks one after another. I did not make any special design rule to express a particular relationship and it does not seem to confuse me (nor other people I hope. :) ) nor does it disturb me NOT to know in particular what kind of relationship (elaboration, enablement, nor list) it is. Which more or less proves my claim.
8. Next step.
First of all I need to concentrate on realizing the design rules. This means take structure progression as it is. I realize that with the current model (Figure 1) I put a big burden on the structure progression module (P1) but never the less I think it is the right way to do it because P2 should only take a plot and translate it into a story using the design rules and template rules available. (and possibly rules from user & delivery context ).
For discussion: the "five hat racks" ways to organize information (Ref 8.) is the scope of P1 not P2.
... to be continued.
9. Reference
Ref
1. Towards Constructive Text, Diagram, and Layout Generation for Information
Presentation - Bateman et.al.
Ref
2. Effective Presentation of Information Through Page Layout: a Linguistically -
Based Approach - Reichenberger et.al.
Ref
3.
Towards Cinematic Hypertext - Clara Mancini et.al.the
paper and the thesis.
Ref
4. Structural Distinction between Hypermedia Storage and Presentation -
Lloyd, Lynda, Jacco & Dick.
Ref 5. Inter-dimensional Hypermedia
Communicative Devices for Rhetorical Structure - Lloyd, Jim, Jacco, & Lynda
Ref
6.
Jacco's blue
note on Discourse Terminology (for reference in the terms used).
Ref 7. Don't Make Me Think by Steven Krug - (Design guidelines)
Ref 8. Universal Principles of Design - William Lidwell et al. (Design
guidelines)
Ref 9. Basic Design and Layout - Alan Swann (Design guidelines)
Ref 10. A non-designers design book - Robin Williams (Design guidlines)