When you turn a tap on, you are adding a certain amount of water per minute to the bath.

So if we look at the graph of the bath filling, we get something like this:
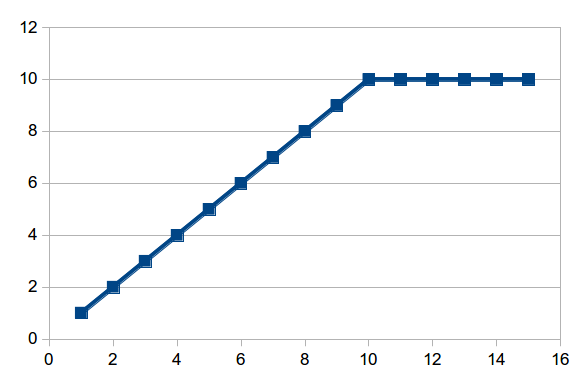
We call this a linear function.
However, for instance, when a bank gives you interest on a bank account, it is not adding a fixed amount every year, but an amount based on how much you have in the bank.
For instance, if they offer a 3% interest, then every year your money gets multiplied by 1.03.
If you have €1000 in your account, then at the end of the year you will have €1000 × 1.03, which is €1030. At the end of the second, you will have €1030 × 1.03, which is €1060.90.
You have surely heard of Moore's Law.
It's not actually a law, more a prediction.
In 1965 Gordon Moore predicted that the density of components in integrated circuits would double each year at constant price 'for at least 10 years'.
In 1975 he adjusted that to a doubling every 18 months.
Moore's Law is also a multiplication: a doubling every 18 months (which is 59% annual interest, if you are interested, or about 4% per month).
If we draw a graph of Moore's Law since 1988, it looks something like this:
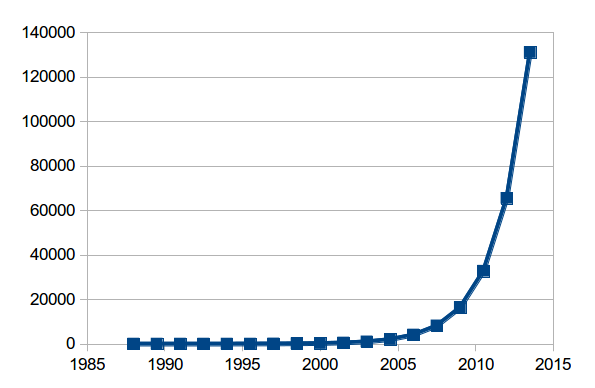
In other words, a computer now is around 130 000 times more powerful than in 1988.
We call this an exponential function.
It is better to graph exponential functions in a different way.
On the vertical axis, rather than going in steps of 1, 2, 3, ... we use steps of 1, 10, 100, 1000, ... Then the exponential graph looks like this:
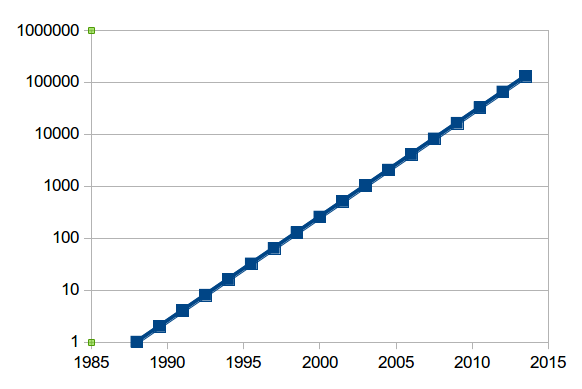
If you use a logarithmic scale, and the graph looks like a line, then it is exponential.
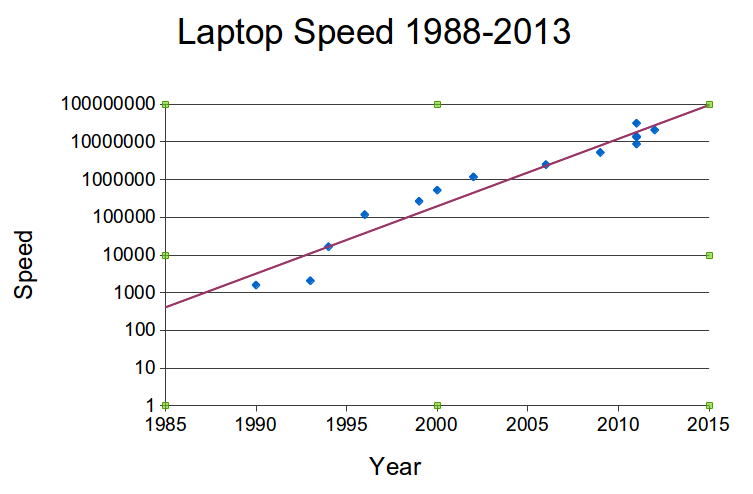
Of course, computers don't get exactly twice as powerful in exactly 18 months.
But I have been collecting data on the power of my computers since 1988.
 Ray
Kurzweil discovered that Moore's Law is just one part of a progression going
back at least as far as 1900
Ray
Kurzweil discovered that Moore's Law is just one part of a progression going
back at least as far as 1900
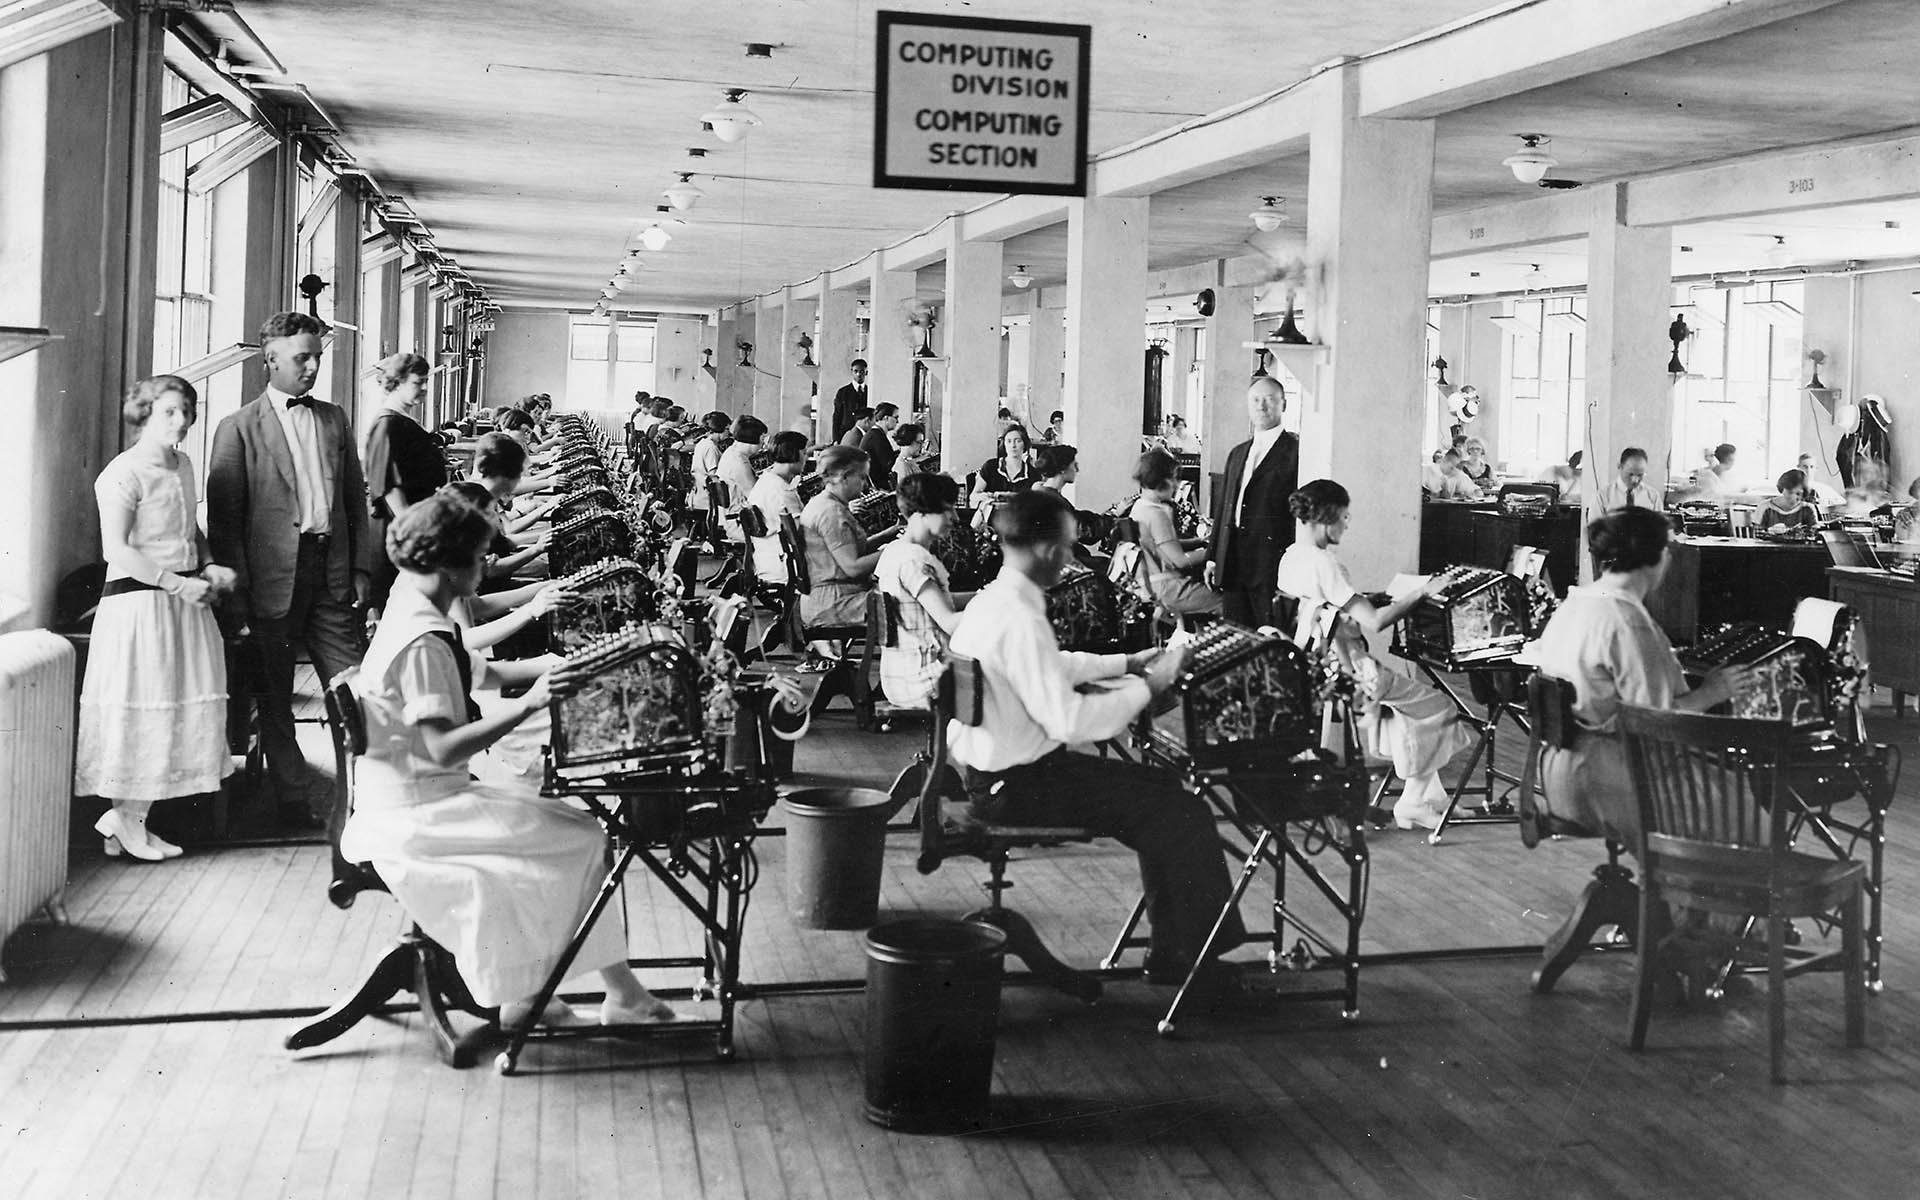
He calculated how many calculations you get for $1000 using 4 generations of technologies, Electromechanical, Relays, Valves and Transistors, and shows that the progression that we call Moore's Law has been going since at least 1900. Here is computing in 1920.
Until the introduction of printing, books were rare, and very, very expensive, maybe something like the same price as a small farm.
Only very rich people, and rich institutions, owned books.

"When the Anglo-Saxon Monkwearmouth-Jarrow Abbey planned to create three copies of the bible in 692—of which one survives—the first step necessary was to plan to breed the cattle to supply the 1,600 calves to give the skin for the vellum required."
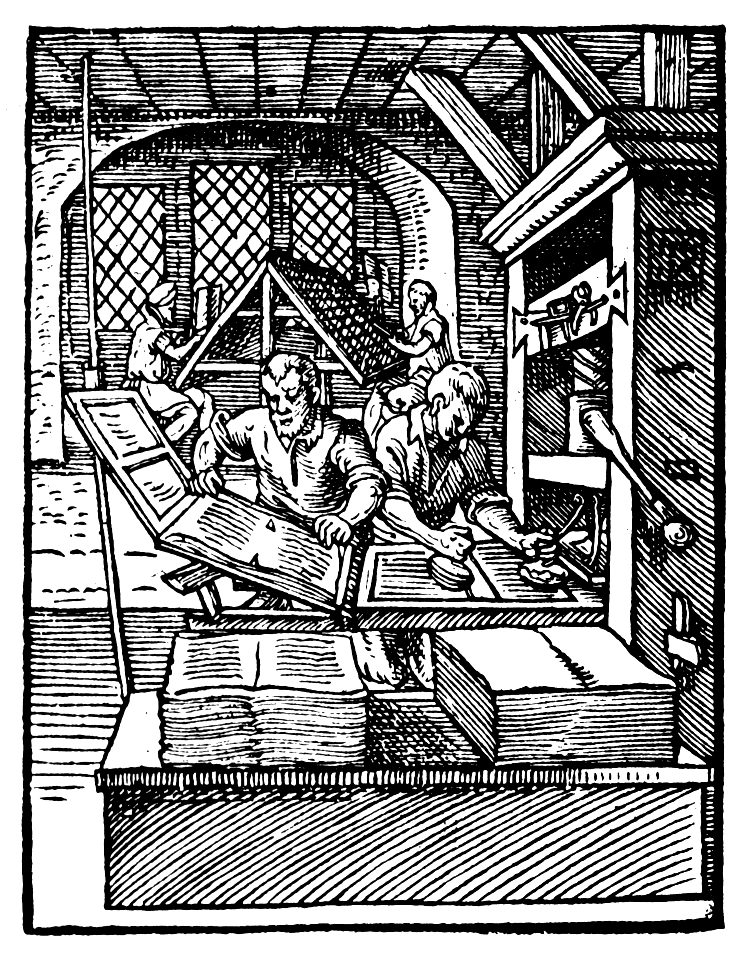
Gutenberg brought known technologies together (just like the web did): ink, paper, wine presses, movable type.
By 1500 there were 1000 printing shops in Europe, which had produced 35,000 titles and 20 million copies.
Price of books greatly diminished (First bible 300 florins, about 3 years wages for a clerk).
Books became a new means of distribution of information.
It was a paradigm shift - new industries, bookshops, newspapers.
Many ascribe the enlightenment to the availability of books.
1665: first scientific journals French Journal des Sçavans and the British Philosophical Transactions (which were actually created to help deal with the information overload scientists were having).
From then on the number of scientific journals doubled every 15 years, right into the 20th century.
Even as late as the 1970's if you had said "there has to come a new way of distributing information to support this growth", they would have thought you crazy, more likely expecting the growth to end.
But now that we have the internet, the amount of information produced continues to increase at an exponential rate (doubling every three years according to one report, every 11 hours according to a newer one).
 I have heard
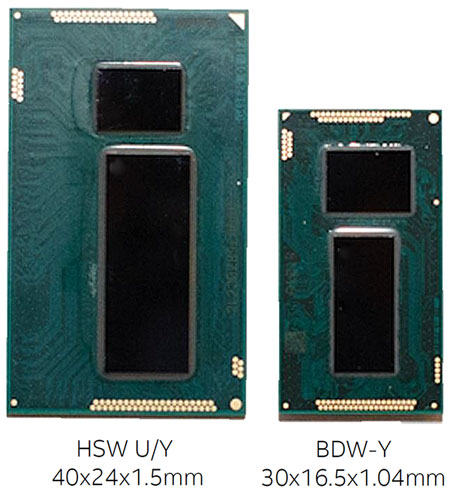
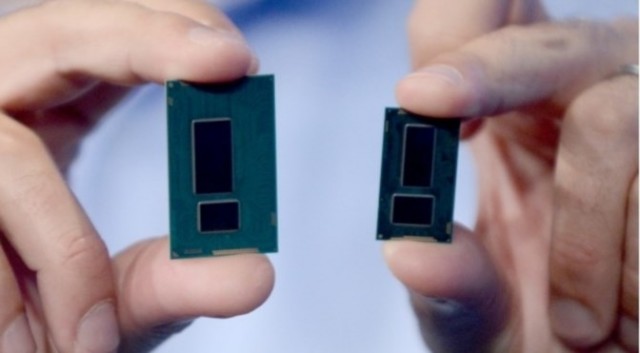
very many times that Moore's Law is nearly over, or (recently) that it
is actually over, but that is not so. Intel recently showed their new 14nm
Broadwell chips off, and they still have at least three shrinkages planned on
their timeline.
I have heard
very many times that Moore's Law is nearly over, or (recently) that it
is actually over, but that is not so. Intel recently showed their new 14nm
Broadwell chips off, and they still have at least three shrinkages planned on
their timeline.
 But even
when it does finally come to an end (for integrated circuits) Kurzweil's
finding gives us an expectation that another technology will replace it.
But even
when it does finally come to an end (for integrated circuits) Kurzweil's
finding gives us an expectation that another technology will replace it.
Often people don't understand the true effects of exponential growth.
A BBC reporter recently: "Your current PC is more powerful than the computer they had on board the first flight to the moon". Right, but oh so wrong.
Take a piece of paper, divide it in two, and write this year's date in one half:
Now divide the other half in two vertically, and write the date 18 months ago in one half:
Now divide the remaining space in half, and write the date 18 months earlier (or in other words 3 years ago) in one half:
Repeat until your pen is thicker than the space you have to divide in two:
This demonstrates that your current computer is more powerful than all other computers you have had put together (and way more powerful than the computer they had on board the first moonshot).
Since current computers have a working life of about 5 years, this means that society as a whole at this moment has around 95% of the computer power it has ever had! (And this will always be true as long as Moore's Law is going).
Moore's Law says you get twice as many components in the same area for the same price every 18 months. Three variables: size, price, components.
This means you have a choice:
In general we have been optimising this choice: computers have been getting smaller, cheaper and more powerful all at the same time: when you buy a new computer, it is typically a little smaller, a little better, and a little cheaper than the last one you had.
Apparently new home computers peaked in 1990 at $4500. We now pay typically around one tenth of that, for a much more powerful computer.
Network bandwidth, just like computers, is also expanding exponentially at constant price.
Except it is doubling per year!
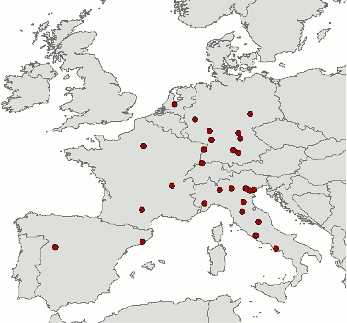
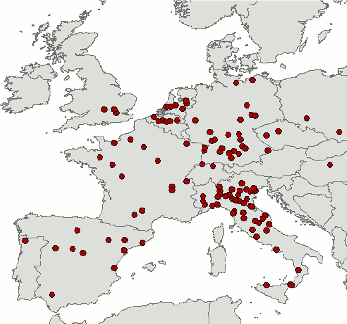
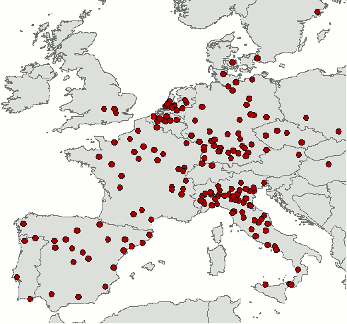
Twenty six years ago this month, internet first started flowing into, and out of, Europe.
At the CWI, in Amsterdam, in an office next to mine.
I was probably the 4th or 5th user of the internet. Maybe the 6th.
It was a "Skunk works" project: no government policy or decisions were involved. Just a bunch of guys who thought it was important.
There was a 64kb/s connection between the whole of Europe and the whole of the USA... a year later to much rejoicing it was increased to 128Kb/s
In retrospect it was no surprise that the speed of the internet doubled from 64kb/s to 128kb/s in its first year.
And, if it has kept up, the speed at Amsterdam should be 64kb/s × 226 which is 4Tb/s. And indeed, data through-put is currently peaking at about 3.5Tb/s.
Well, that was 1988. That was the internet.
There was no web until a few years later.
It wasn't until 1995 that we began to get an idea that the web was going to be so successful.
In those days the message was "if you have information, it should be on the web". It was surprising how many people didn't understand that.
Now with the coming of the Open Linked Data movement, that call has become "If you have data, it should be in machine-readable form on the internet".
And this is what is powering the possibility of the Smart City:
So the world has basically understood the idea of open information.
But now for open data.
There is the story of the Amsterdam Fireservice that couldn't get hold of the data about which roads were being dug up.
That is one sort of reason why we need open data.
But there are other reasons, that we just don't know until we do it: making data available enables new applications.
But just having the data is not enough.
The data has to be usable as well, so that meaningful decisions can be based on its use.
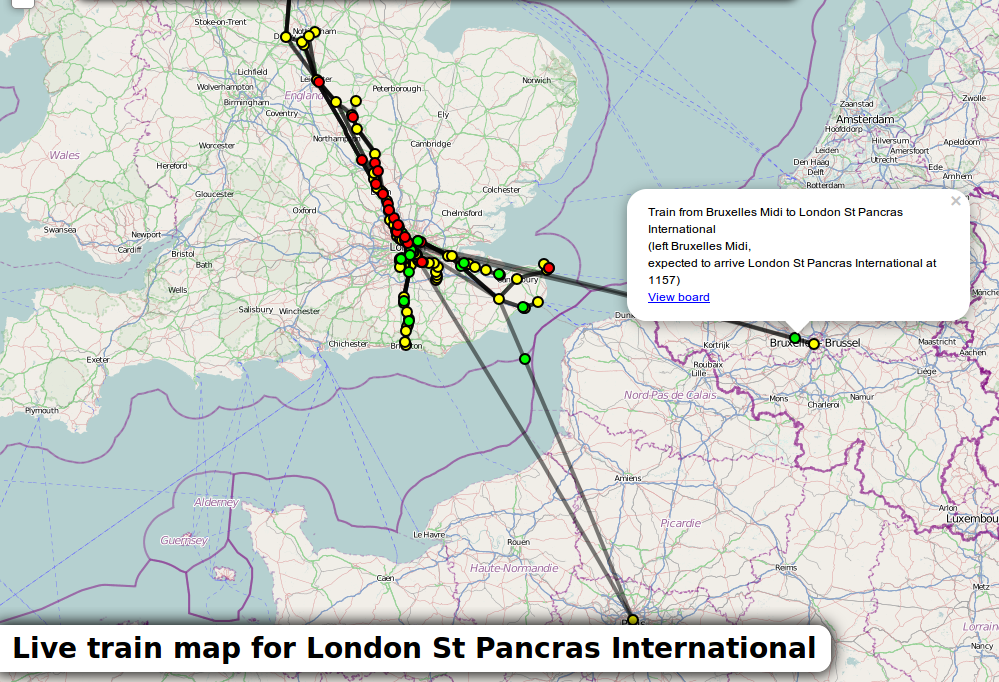
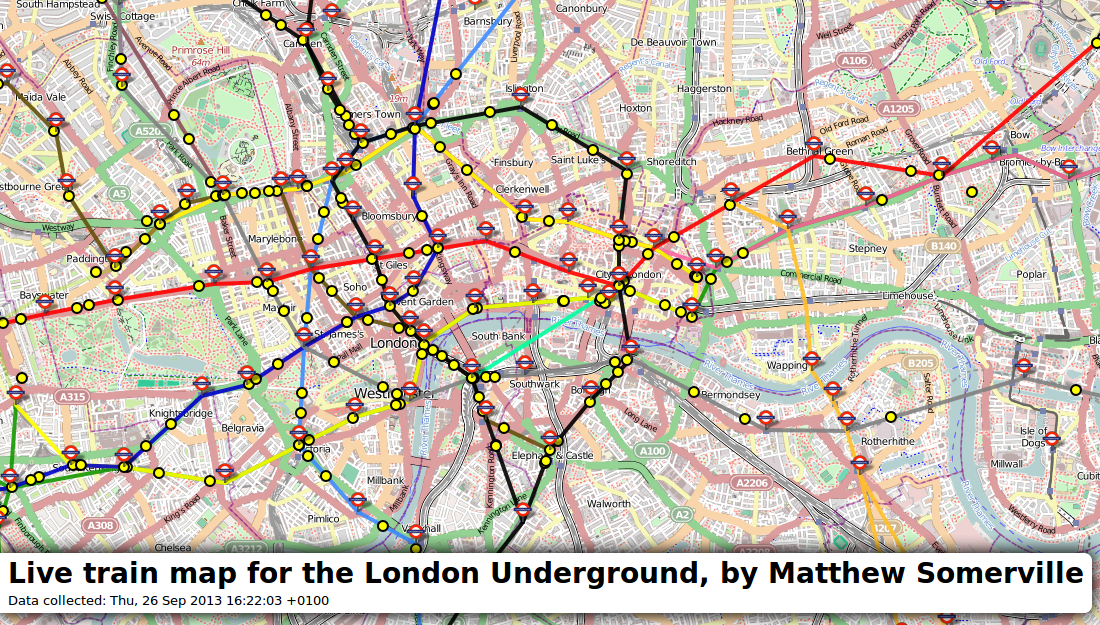
Transport for London released live data of where its Tube Trains are.
And before you knew it, there was this, built at a Science Hackday: http://traintimes.org.uk/map/tube/
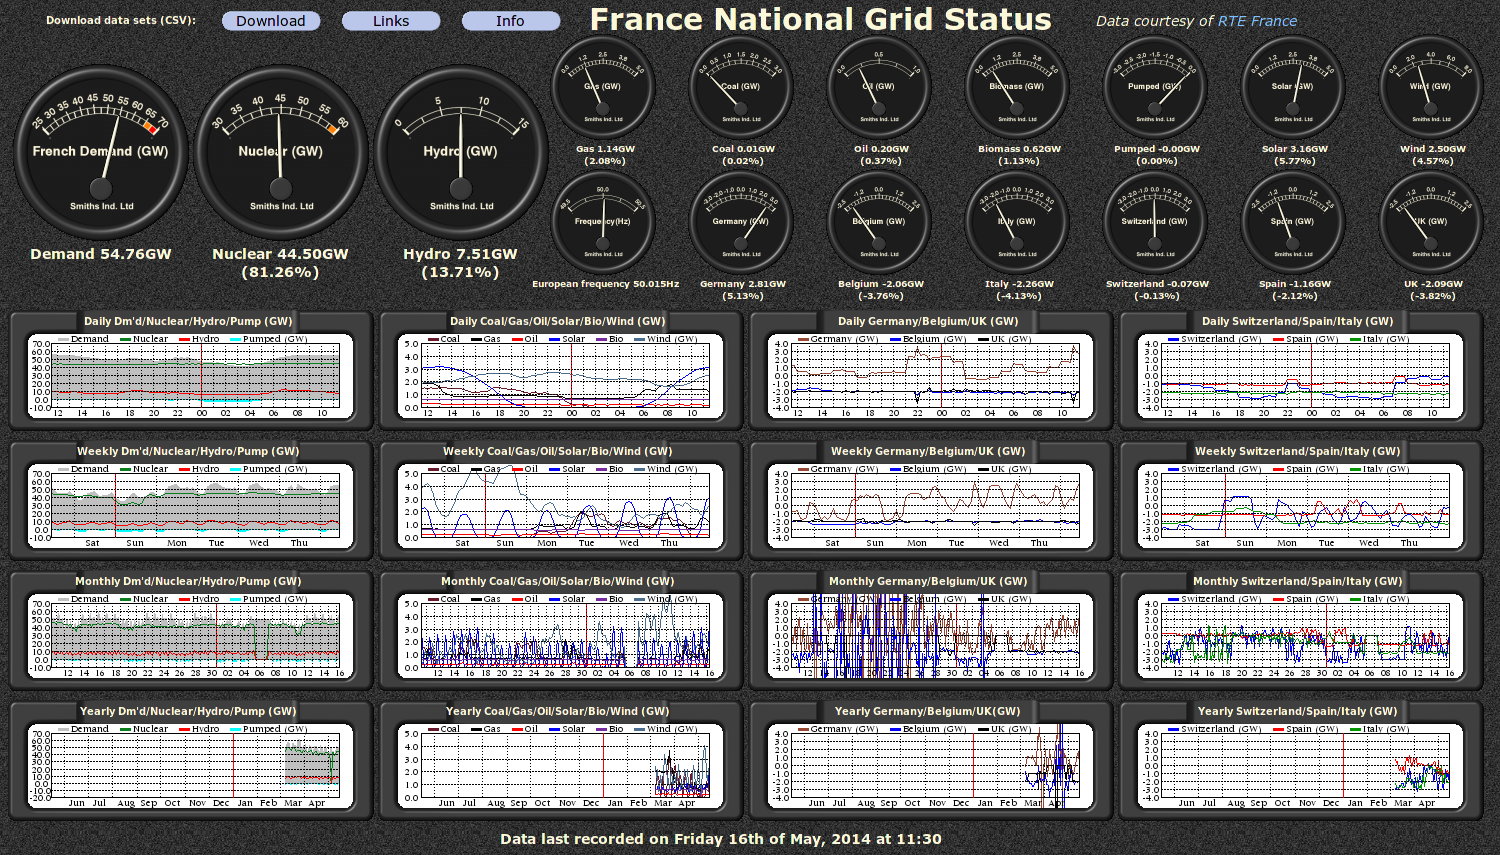
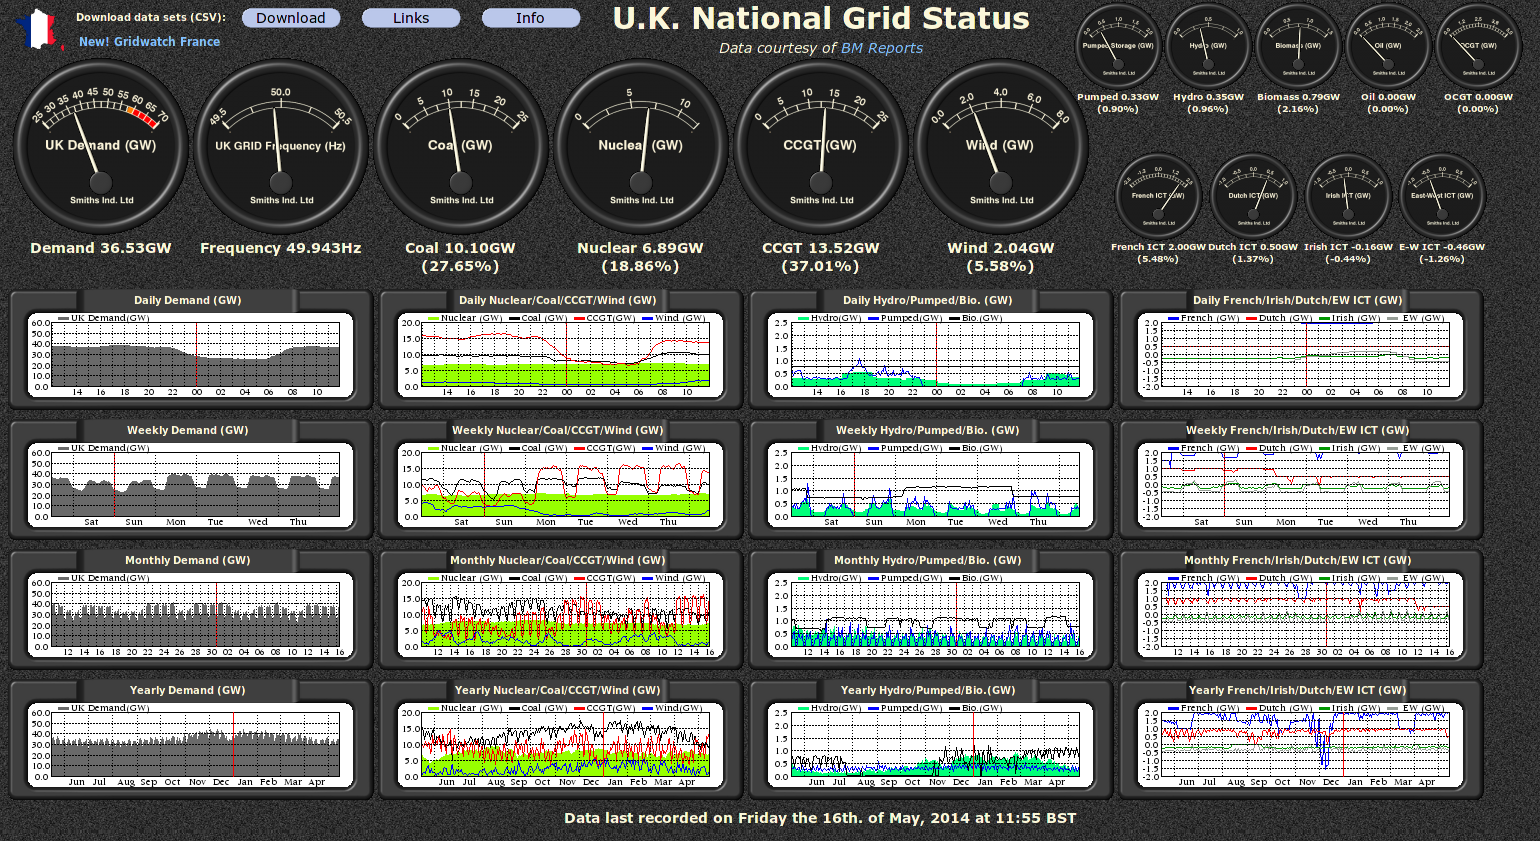
Live data was released for all energy sources attached to the UK National Electricity Grid. Which enabled http://www.gridwatch.templar.co.uk/
Computers are becoming cheaper, more powerful and more plentiful.
Data is becoming more available.
But programmers are not becoming more plentiful at nearly the same rate.
And programmers are certainly not becoming cheaper.
We need a new paradigm of programming.
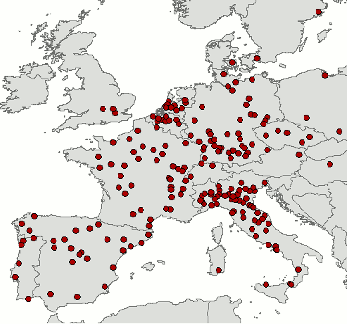
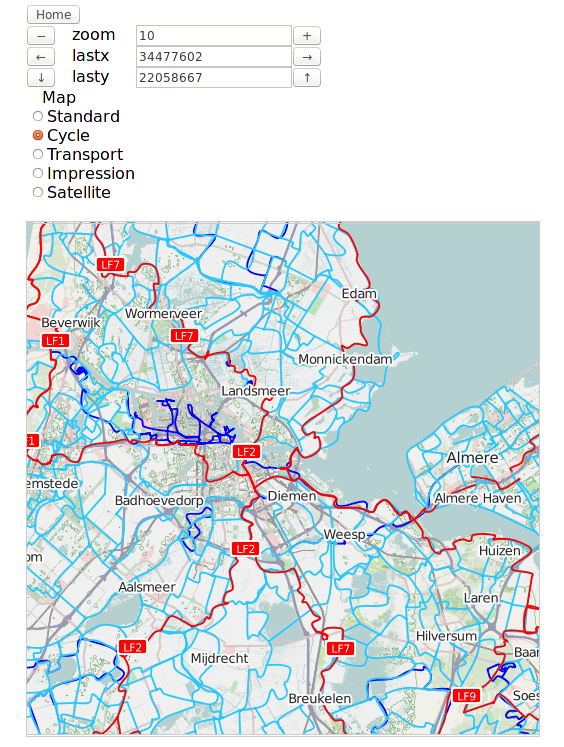
Here is an example of an application based on Open Street Map, displaying a cycling map of Amsterdam, rendered using data from Open Street Map:
The exponential growth that we are experiencing seems to be a part of a larger historical trend.
To make data useful, it has to be usable.
The greatest hurdle is finding a new programming paradigm that reduces the costs of programming by at least an order of magnitude.