In XForms you can put the URL of an image in your data:
<instance>
   <data xmlns="">
      <url>http://tile.openstreetmap.org/10/511/340.png</url>
   </data>
</instance>
and output it with
<output ref="url"/>
This would give as output:
http://tile.openstreetmap.org/10/511/340.png
But if you add a mediatype to the <output>,
the image itself is output instead:
<output ref="url" mediatype="image/*" />
An Open Street Map URL is made up as:
http://<site>/<zoom>/<x>/<y>.png
So we can represent that in XForms data:
<instance>
   <map xmlns="">
      <site>http://tile.openstreetmap.org/</site>
      <zoom>10</zoom>
      <x>511</x>
      <y>340</y>
      <url/>
   </map>
</instance>
and calculate the URL from the parts:
<bind ref="url"
      calculate="concat(../site, ../zoom, '/', ../x, '/', ../y, '.png')"/>
But now that we have the data, we can also input the different parts:
<input ref="zoom"><label>zoom</label></input>
This means that we can enter different values for the tile coordinates, and because XForms keep all relationships up-to-date, a new tile URL is calculated and the corresponding tile is displayed.
However, since entering numbers like this is inconvenient, we can also add some nudge buttons, of the form:
<trigger>
   <label>→</label>
   <setvalue ev:event="DOMActivate" ref="x" value=". + 1"/>
</trigger>
so it looks like this:
The x and y nudge buttons work fine, the zoom button doesn't.
At each level of zoom the x and y coordinates change:
So to make zoom work properly, we must save our location in world coordinates, each value between 0 and 226 (which is the 18 levels of zoom, plus 8 bits for the 256 pixels of each tile), and then calculate the tile at any level of zoom from that:
scale=226 - zoom
x=floor(posx/scale)
y=floor(posy/scale)
In XForms:
<bind ref="scale" calculate="power(2, 26 - ../zoom)"/>
<bind ref="x" calculate="floor(../posx div ../scale)"/>
<bind ref="y" calculate="floor(../posy div ../scale)"/>
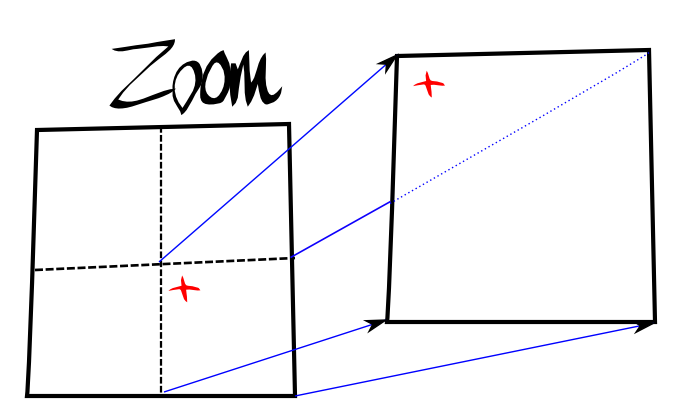 When you
zoom in and out, you get the tile that includes the location, but that the
location is in a different place on each tile.
When you
zoom in and out, you get the tile that includes the location, but that the
location is in a different place on each tile.
This is because if you have a tile where the location is in the middle of the tile, when you zoom in, you get one of the 4 quadrants, and so by definition, the location is no longer at the centre of the tile.
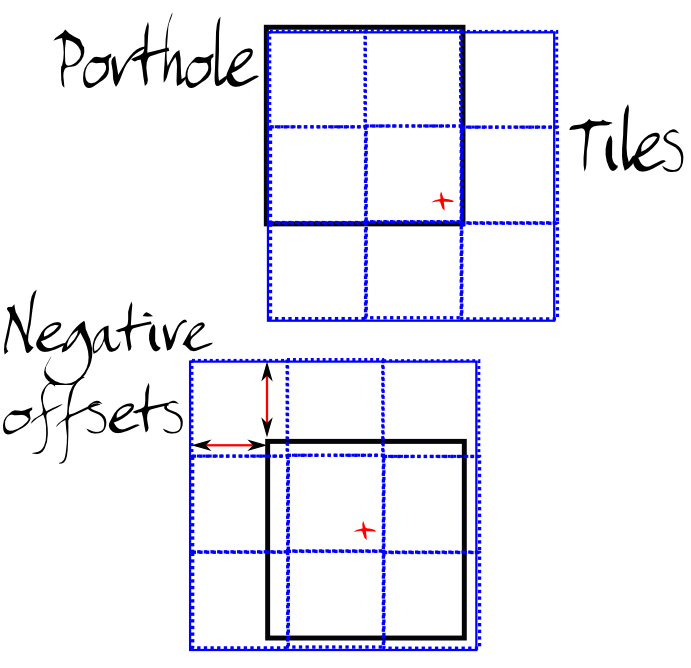 We create a 3×3 array of
tiles, with a porthole over it.
We create a 3×3 array of
tiles, with a porthole over it.
The porthole stays static, and the tiles are shifted around underneath so that the location remains in the centre.
This is done by calculating offsets that the tile array has to be shifted by, and then using these to construct a snippet of CSS to move the tile array:
<bind ref="offx"
   calculate="0 - floor(((../posx - ../x * ../scale) div ../scale)*../tilesize)" />
<bind ref="offy"
   calculate="0 - floor(((../posy - ../y * ../scale) div ../scale)*../tilesize)" />
 ...
<div style="margin-left: {offx}; margin-top: {offy}">
Now we have a live map, where we can zoom in and out, and pan left and right and up and down.
To help understand how this works, here is a view also showing the parts that would normally not be visible outside of the porthole:
Of course, what we really want is to be able to drag the map around with the mouse, not have to click on nudge buttons. Now we're really going to see the power of live data! We will want to know the position of the mouse, and the state of the button, up or down. So we create instance data for that:
<mouse>
   <x/><y/><state/>
</mouse>
and then we catch the mouse events:
<action ev:event="mousemove">
   <setvalue ref="mouse/x" value="event('clientX')"/>
   <setvalue ref="mouse/y" value="event('clientY')"/>
</action>
<action ev:event="mousedown">
   <setvalue ref="mouse/state">down</setvalue>
</action>
<action ev:event="mouseup">
   <setvalue ref="mouse/state">up</setvalue>
</action>
Now we have live data for the mouse!
We can show the state of the mouse by adding a value for which cursor to use
<bind ref="cursor" calculate="if(../state='up', 'pointer', 'move')"/>
and styling suitably:
style="cursor: {cursor}"
The last bit is that we want is to save the start and end point of a move, so we can calculate how far we have dragged. The instance data is extended:
<mouse>
   <x/><y/><state/><cursor/>
   <start><x/><y/></start>
   <end><x/><y/></end>
   <move><x/><y/></move>
</mouse>
We capture the start point of the drag when the mouse button goes down:
<action ev:event="mousedown">
   <setvalue ref="mouse/state">down</setvalue>
   <setvalue ref="mouse/start/x" value="event('clientX')"/>
   <setvalue ref="mouse/start/y" value="event('clientY')"/>
</action>
While the mouse button is down, we save the end position:
<bind ref="mouse/end/x"
      calculate="if(/map/mouse/state = 'down', /map/mouse/x, .)"/>
<bind ref="mouse/end/y"
      calculate="if(/map/mouse/state = 'down', /map/mouse/y, .)"/>
And calculate the distance moved as just end - start:
<bind ref="mouse/move/x"
      calculate="mouse/end/x - mouse/start/x"/>
<bind ref="mouse/move/y"
      calculate="mouse/end/y - mouse/start/y"/>
The position of the map is recorded in posx and
posy, but now also depends on the mouse dragging.
Add instance data to record the last position:
<lastx/><lasty/>
Keep posx and posy updated (we divide by the tile
size to get the number of positions represented by a pixel):
<bind ref="posx"
      calculate="../lastx - ../mouse/move/x * (../scale div ../tilesize)"/>
<bind ref="posy"
      calculate="../lasty - ../mouse/move/y * (../scale div ../tilesize)"/>
Reset lastx and lasty when the dragging stops:
<action ev:event="mouseup">
   <setvalue ref="lastx" value="posx"/>
   <setvalue ref="lasty" value="posy"/>
   <setvalue ref="mouse/start/x" value="mouse/end/x"/>
   <setvalue ref="mouse/start/y" value="mouse/end/y"/>
</action>
Although from the user's point of view it feels like you are grabbing the map and dragging it around, all that is happening underneath is that we are tracking the live data representing the mouse, and using it to alter the live data that represents the centre of the map.
Once we have this foundation, it is trivial to add things like a "Home" button, to add keystroke shortcuts, to zoom in and out with the mouse wheel, or to select tiles for another version of the map. For instance:
<select1 ref="site">
   <label>Map</label>
   <item>
      <label>Standard</label>
      <value>http://tile.openstreetmap.org/</value>
   </item>
   <item>
      <label>Cycle</label>
      <value>http://tile.opencyclemap.org/cycle/</value>
   </item>
   <item>
      <label>Transport</label>
      <value>http://tile2.opencyclemap.org/transport/</value>
   </item>
   ...
</select1>
Thanks to the live data, any time a different value is selected for "site", all the tiles get updated, without any further work from us.
A map like this can be seen as the presentation of two values, an x and y coordinate, overlaid with an input control to affect the values of x and y.
The ability of XForms to abstract the data out of an application and make the data live via simple declarative invariants makes the construction of interactive applications extremely simple.
The above example is around 150 lines of XForms code, in sharp contrast to the several thousand lines that a procedural programming language would need.
Open Street Map data is © OpenStreetMap contributors, licensed as CC BY-SA.