Issue
Article
Vol.28 No.3, July 1996
Article
Issue
Issue |
Article |
Vol.28 No.3, July 1996 |
Article |
Issue |
We present a prototype system to be used for visually accessing heterogeneous databases. The basic idea is to provide the user with several visual representations of data as well as multiple interaction mechanisms for both querying databases and visualizing the query results. Since some visual representations better fit certain user classes, the system adapts to the user's needs by switching to the most appropriate visual representation and interaction mechanism, according to a suitable user model. The data and query representations are consistent in every paradigm. Such a notion of consistency stems from formal basis, i.e. a twofold data/representation model, namely the Graph Model, and a set of basic Graphical Primitives. This formal approach allows the user to switch from one interaction paradigm to another, always saving the query state.
Recently, the so-called Visual Query Systems (VQSs) have acquired a prominent role as tools for providing database access (see, e.g. [6, 7]). VQSs may be defined as query systems essentially based on the use of visual representations to depict the domain of interest and express the related requests. They are oriented to a wide spectrum of users who have limited technical skills and generally ignore the inner structure of the accessed database, because they typically offer to the user a representation of the information that is independent of the structure or the location of the actual data.
Two serious problems of existing VQSs are 1) their lack of adaptive capabilities, i.e. they do not cope with the various needs of the different users, and 2) their limitation in interfacing single, homogeneous databases only, i.e. they are not able to access global information systems, made of different heterogeneous databases, a critical need of today information systems (see, e.g., [16]). As for the first aspect, existing VQSs generally restrict the human-computer communication to only one kind of interaction paradigm. On the contrary, the presence of several paradigms, each one with different characteristics and advantages will help both naive and experienced users to interact with the system.
The main goal of our approach is to allow different classes of users to access multiple, heterogeneous databases by means of an adaptive interface, offering several interaction mechanisms. This aim led us to design and partially implement a visual query system, exhibiting both user-oriented and multidatabase characteristics. The most notable features of our approach are: 1) the presence of a common formalism, namely the Graph Model, sufficiently abstract to represent, in principle, both databases expressed in any of the most common data models and well-known visual representations, and equipped with suitable constraints to better organize the presentation of the query result; 2) the definition of a set of elementary graphical actions (such as selection of nodes and drawing of edges), called Graphical Primitives (GPs), having a clear semantics and in terms of which more complex visual interaction mechanisms may be defined; 3) the precise definition of suitable translations among different representations in terms of both database content and visual interaction mechanisms; 4) the construction and the management of an effective user model, that allows the system to propose to the user the most appropriate visual representation according to his or her skill and needs.
On one hand, the Graph Model is powerful enough to express the semantics of most of the common data models, so it is suitable as a unifying canonical model. A user can query and examine results using a conceptually single database, namely a Graph Model Database (GMDB). Then, his or her query is translated into a set of queries which are executed on the component databases, and the results of these are combined to form a single result. The user is thus oblivious to the existence of the underlying databases, and need not be concerned with their specific storage formats or query languages. On the other hand, the semantics of the query operations as expressed in the various representations is uniformly defined in terms of the GPs, so to allow the user to change visual representation during the query formulation.
As the user can switch among different visual representations while formulating the query, he or she can also switch when visualizing the result produced by the query execution. Again, several representations are available, and the one used to display the query result can be different from that used in the query phase. This is mainly due to the fact that very often what is visualized for the query purpose is the schema of the database, while the actual database instances constitute the query result to be displayed to the user.
The work on the above query system has been carried out at the Universities of Rome "La Sapienza" (Dipartimento di Informatica e Sistemistica and Dipartimento di Scienze dell'Informazione) and at the University of Bari, in cooperation with Professor S.K.Chang, University of Pittsburgh, USA, mainly in the framework of the Esprit Project 6398 "VENUS". This Project has evolved during several years, producing various partial results (some relevant publications are [4, 5, 8, 10, 14, 13, 17, 18, 19]), and an implemented prototype. This paper mainly concentrates on the system prototype, in particular on its user-oriented features, also describing some preliminary usability trials. The paper is organized as follows. first we introduce the system architecture. Then the formal basis of the multiparadigmatic approach are recalled. In the following section the visual representations and interaction mechanisms for the query phase are illustrated, also showing an example of interaction. We then deal with the various visual mechanisms for the query result presentation followed by a section devoted to user-related topics, i.e. a description of the user model system component and a brief report on the usability trials. Finally, conclusions are drawn.
In Figure 1 the architecture of the proposed system is shown. The system consists of a Visual Interface, a User Model Manager, a Query Formulation Manager, a Result Visualization Manager, and a DBMS Interface, interacting with one or more underlying Database Management Systems. The kernel of the system consists of the three managers that are cooperating processes.
The Query Formulation Manager is capable of supporting several paradigms for visual representations, e.g., form-based, iconic, diagrammatic representations (see [7] for a precise definition of visual representation), providing for each of them a suitable representation of the internal query language operators (see [5]) and allowing the user to switch among them while expressing the query. At the beginning, the Query Formulation Manager selects the visual representation most appropriate for the current user based upon the user model elaborated by the User Model Manager (see [4]). Equivalent queries may be expressed using the different interaction modalities associated with the various visual representations. The User Model Manager continuously collects data about the actions performed by the user, maintaining a knowledge-base of the user model components. Once a query has been expressed by the user, the Query Formulation Manager interacts with the DBMS interface that, in turn, handles problems arising from data distribution and heterogeneity of the underlying databases and computes the query result [8, 10].
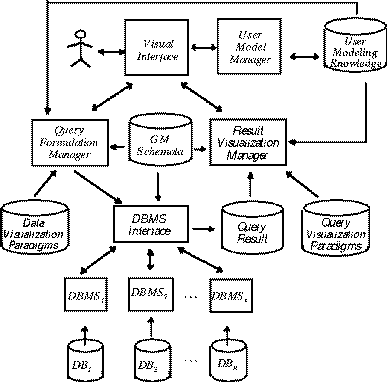
Figure 1: The System Architecture
The Result Visualization Manager presents to the user the query result by exploiting one of the available visual representations (e.g., virtual reality, forms, nested forms, etc.). At the beginning, the user is faced with the most appropriate representation, according to his or her model, and the Result Visualization Manager allows for switching among the different representations during the browsing of the query result.
For the time being, a prototype of the system has been implemented. It is made of different processes, working on different hw/sw platforms (MS DOS, Windows, Unix) and communicating through shared files. The prototype includes two visual paradigms for the query phase (diagrammatic and iconic) and two for the result presentation phase (virtual reality and nested forms). We are currently working to extend the capabilities of the prototype, adding more paradigms for both the query and the visualization phases and enhancing the integration among the different modules.
In this section we briefly recall the formal basis of our work, by illustrating the concepts of Graph Model, Graphical Primitives and Structure Tree.
A Graph Model DataBase D is a triple <g, c, m>, where g is a Typed Graph, c is a set of Constraints, and m is an Interpretation. The schema of a database, i.e. its intensional part, is represented in the Graph Model by the Typed Graph and the set of Constraints. The instances of a database, i.e. its extensional part, are represented by the notion of Interpretation.
More precisely, the Typed Graph is a labeled graph, where the set of nodes is partitioned into two sets, one representing classes, i.e. class-nodes, and the other one representing relations (here called roles), i.e. role-nodes. The arcs connecting class-nodes to role-nodes represent the links between classes and roles. Moreover, the set of class-nodes is in turn partitioned into the set of printable class-nodes (concrete classes), and the set of unprintable class-nodes (abstract classes). The former represent sets of objects denoted simply by object identifiers, whereas the latter represent sets of objects that are actually values of distinguished domains (integer, real, character, etc.).
The second component of the Graph Model, namely the Constraint language, allows the designer to specify relevant conditions on and meaningful properties of the classes and the roles represented by the nodes in the Typed Graph. The most common constraints are: the isa constraints, used for representing subclass-class relationships, and the cardinality constraints, that allow for limiting the number of objects participating in relations.
The third component of a GMDB is the Interpretation. An Interpretation for a Typed Graph g is a function mapping the printable class-nodes of g to a subset of the set of elementary printable values, the unprintable class-nodes to a subset of the set of elementary unprintable values, and the role-nodes to a subset of a set of structured objects. In particular, given a role-node n, its Interpretation is constituted by a set of tuples whose arity is equal to the number of class-nodes adjacent to n, and each component is labeled with the label of one adjacent class-node and takes its values in the corresponding Interpretation.
Associated with the Graph Model are the Graphical Primitives, first introduced in [8]. The main idea is to express any query-oriented user interaction with a database in terms of two simple graphical operations: the selection of a node and the drawing of a labeled edge. The former corresponds to switching the state of a node, from unselected to selected to displayed, and vice versa. The latter is the linkage of two nodes by a labeled edge, and corresponds to either restricting the node Interpretations according to the rules stated in the label, or performing a set operation on them. It has been shown in [8] that by using these simple operations it is possible to express at least all first order queries, i.e. the GPs have at least the same expressive power than the relational algebra [2].
Applying a set of GPs on a GMDB D results again in a GMDB D'. In our system the user can switch from one interaction paradigm to another during the query formulation, still finding the state of the query consistently updated in all the paradigms. To ensure this consistency, which implies a deterministic translation, the switching is allowed only when the visual operations performed by the user have an unambiguous semantics in terms of GPs. This is constantly verified by the system, that allows the user to change representation only when his or her query is atomic. We say that a query q on the GMDB D is atomic if the database D', obtained by applying to D the Graphical Primitives corresponding to q, is admissible, i.e., it contains at least one displayed role-node, and each displayed role-node is linked to at least one displayed printable class-node and one unprintable (selected or displayed) class-node, see [5] for further details. The check of the query atomicity is obviously transparent to the user, who is prevented from changing representation while the query is not in the correct state for the switching. Furthermore, if the user tries to change representation when this is not allowed, the system suggests him or her several alternatives for completing the query in order to become atomic.
As we said above, the GPs allow the user to express queries on the underlying GMDB. When the corresponding Typed Graph contains many role-nodes having associated one-to-many cardinality constraints, the dataset composing the query result may be constituted by many objects which are arranged into different levels of nesting. In order to reflect such a nested structure, we introduce the notion of structure tree. Similarly to the nested relation [2], a structure tree is recursively defined as:
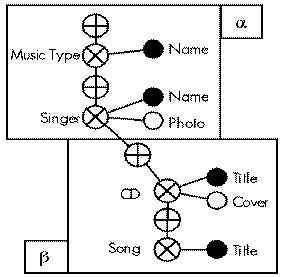
Figure 2: The Structure Tree of the Queries alpha + beta
The domain V corresponds to a printable class-node; the record_end structure is associated with a subgraph of the Typed Graph made of an unprintable class-node together with a set of linked displayed printable nodes; the set_of structure occurs each time an unprintable class-node is reached by traversing a role-node representing a one-to-many relationship.
Referring to a database containing information about singers, songs, and related compact disks, consider the following query:
α Retrieve all names of every music type. For each music type, retrieve the name and the photo of the singers typically singing such music type. For each singer display:
� information about all the CDs of which the singer is the main author. In particular, display the CD title plus title of all songs contained in the CD.
The structure tree associated with the previous query is shown in Figure 2, where the set_of and record_end constructs are displayed with the symbols ⊕ and ⊗ respectively. The circles attached to record_end symbols represent the atomic attributes, key attributes are evidentiated by black circles.
It is our opinion that, in order to improve the communication with users of any type, a query system should be flexible, providing multiple representations for both databases and queries performed on them. This is the approach we propose in our system, that adapts its interaction style to the user. The system displays several windows, each one containing a different visual representation. At the beginning, the largest window shows the visual representation that the system evaluates to be the most appropriate for the current user, and in the subsequent interaction such a window always displays the representation that is currently in use. The smaller windows show the other available representations. We consider a minimal set of basic representations, i.e., form-based, diagrammatic, iconic, virtual reality-based, and hybrid (where two or more representations are combined together). Such visual representations, together with their interaction mechanisms, have been given a precise semantics in terms of the Graph Model and the Graphical Primitives (see the previous section). It is out of the scope of this paper to describe these correspondences, the interested reader can find more details in [4, 5].
Form-based representations are the first attempt to provide the user with friendly interfaces for data manipulation. Their main characteristic consists in visualizing prototypical forms, where queries are formulated by filling appropriate fields. Concerning the mapping with the Graph Model and GPs, we can say that form columns correspond to class-nodes, role-nodes are represented by form headers grouping different columns, and the interaction mechanisms are the selection of a header and the filling of an empty cell with a string.
Diagrammatic representations are widely used in existing systems. Typically, they represent the various types of concepts available in a data model by simple geometrical elements connected through lines. The mapping with the Graph Model is straightforward, since the model itself is based on a graph-theoretical structure. Roughly speaking, geometrical elements correspond to class-nodes and connections among them to role-nodes. The main interaction mechanisms are the selection of elements and the navigation along diagram paths. The diagrammatic representation that has been implemented in the system prototype was inspired by the Entity Relationship model [14], while the actual interaction mechanisms come from a visual query system, namely Query By Diagram [1].
Iconic representations use sets of icons to denote both the objects of the database and the operations to be performed on them. A query is expressed primarily by combining icons. Concerning the mapping with the Graph Model and GPs, we can say that icons correspond to class-nodes, pop-up child windows to role-nodes (together with the associated class-nodes), and the user is provided with the simple operations of selecting and dragging icons. The actual iconic interaction mechanisms in the prototype resemble Query By Icon [18].
The representation based on Virtual Reality (VR for short) has been introduced as a new interaction paradigm particularly suited to novice and/or occasional users [13], who are facilitated by the realistic rendering of the interface. Typical VR navigation tools are both zooming mechanisms and spatial operators that allow to move into a virtual reality scene. The only other available interaction mechanism is the pointing to a specific database object visible in the scene. Referring to the Graph Model, in VR it is possible to manipulate only objects corresponding to unprintable nodes. As a consequence, the VR can be used either for formulating simple queries or as a starting interaction mechanism followed by a switching operation.
In the following we show a working example, in which the user interacts with the diagrammatic and the iconic representations. Assume the user is dealing with a database containing information about singers, songs, and related compact disks, and that he or she is interested in looking at pop-music compact disks. The user initially interacts with the diagrammatic interface as shown in Figure 3, and he or she selects the path <music-type, sings, singer> finding out all the singers playing a particular kind of music. In the underlying Graph Model the unprintable class-nodes corresponding to the entities music-type and singer, plus the role-node corresponding to the relationship sings are now in the selected state. Moreover, depending on the attributes the user has asked to visualize in the final result, several printable nodes are in the displayed state (in the example, the nodes corresponding to the name of the music-type and the name and the photo of the singer).
After that, the user wants to reach the entity CD but, being confused by the presence of two different paths reaching that entity, he or she decides to switch to the iconic paradigm of interaction. The query is atomic, so the switching is possible and the user is presented with the set of icons shown in Figure 4. In particular, the icon corresponding to the unprintable class-node Music-Type has been automatically dragged in the Query Space and the icon corresponding to the unprintable class-node Singer appears as first element in the Browser window showing all the possible paths starting from Music-Type.
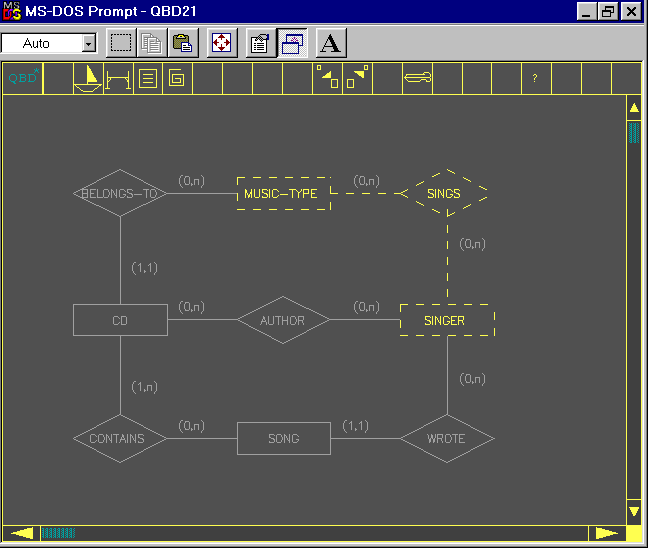
Figure 3: The Diagrammatic Interaction Paradigm
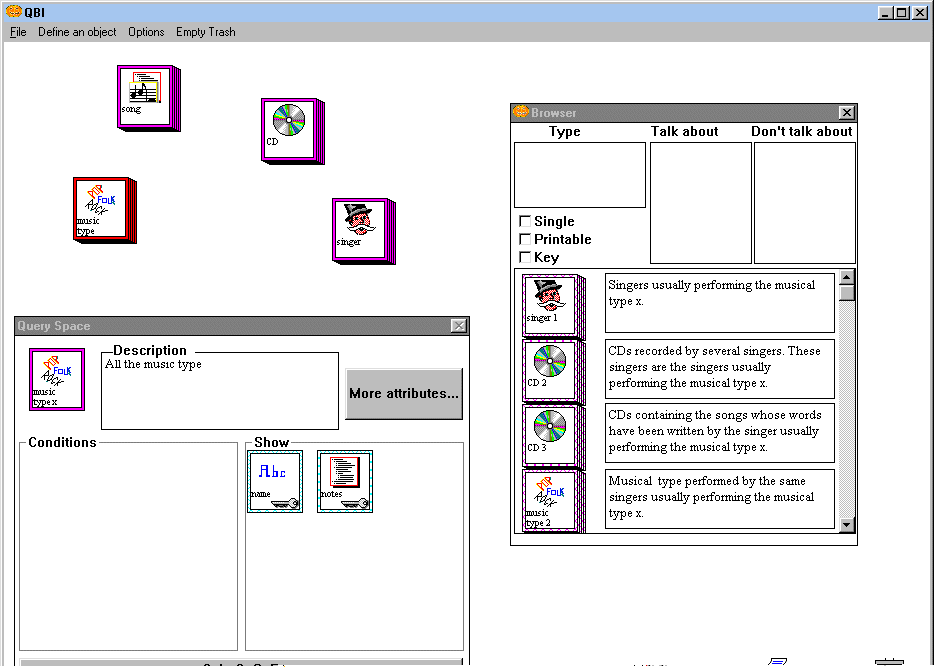
Figure 4: The Iconic Interaction Paradigm
By inspecting the text associated with the icons representing compact disks, the user may easily choose the one he or she is looking for.
Visual query interfaces may help even inexperienced users providing them with tools for effectively visualizing and browsing the query result, which may be constituted by a large amount of structured information. Different visual representations can be adopted while presenting different kinds of data. Form-based representations are useful for representing in a very compact way large set of textual data and are easily graspable by non-expert users. 3D display methods can be usefully adopted for managing large sets of objects. Indeed, by means of perspective visualization, users are provided with a simple type of fish-eye view [21] and they can focus on a small part of the whole dataset. Moreover, 3D environments can easily accommodate standard as well as multimedia data, like pictures and videos.
Virtual Reality techniques allow one to combine the advantages of 3D visualization with the power of metaphorical representations. Arranging the data of the query result into virtual reality scenes, users should be facilitated in the exploration of information since they interact with familiar objects. As a consequence, no particular learning should be required to explore the dataset. Furthermore, since virtual reality scenes can be enriched with many details (e.g. a painting in a room or a flower vase), users can easily locate the database objects within a certain context.
Referring to the architecture shown in Figure 1, the Result Visualization Manager takes into account the abstract organization of the query result, represented as a structure tree, and generates different kinds of visual representations of the corresponding dataset. The Result Visualization Manager is also responsible for processing the user requests, which can be partitioned into:
In this subsection we present an example of interaction referring to the query and the corresponding structure tree as introduced earlier (see Figure 2). The user starts exploring the query result using a form-based representation. As shown in Figure 5, each column represents a record_end node of the structure tree, and a link between a pair of columns represents set_of nodes of the structure tree. For each column, the name of the represented node (e.g., music type) and the name of a corresponding key attribute (e.g., name) are displayed on top of the column itself. The lower portion of the column contains the list of values for the key attribute of the objects belonging to the record_end node. If the user chooses the pop value in the first column and then issues an EXPAND command, the subset of singers usually singing the pop music type is displayed in the singer column.
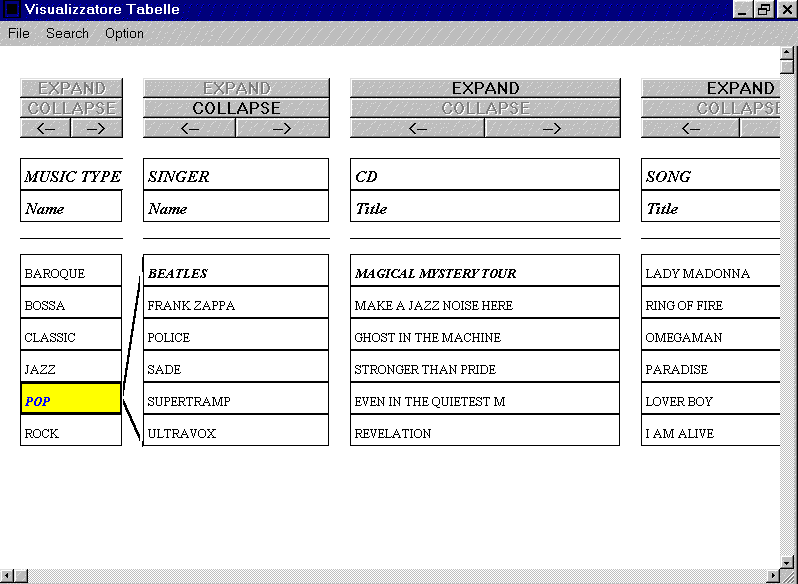
Figure 5: Query Result in the form-based representation
The user, after having explored a first part of the query result using the form-based representation, issues a SWITCH_TO_VR command. In response to this command, the Result Visualization Manager builds a 3D scene corresponding to the same portion of the structure tree, previously represented in a tabular form. According to the VR, record_end nodes of the structure tree are displayed by means of generic containers, like a room or a drawer, and set_of nodes are represented as modular objects, like the drawer classifier shown in Figure 6 (see [17] for details on the automatic choice of the visual metaphor).
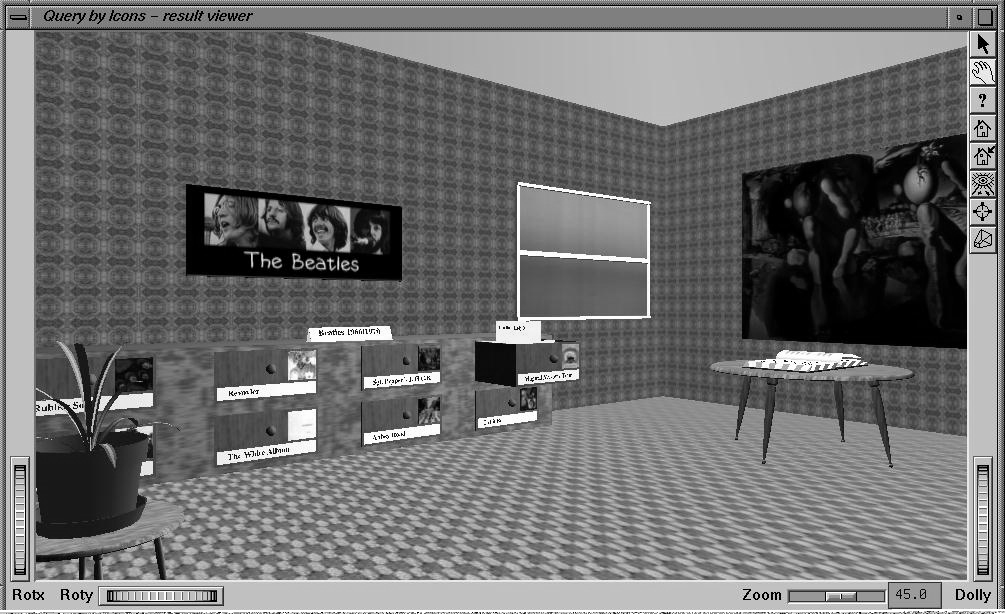
Figure 6: The Beatles'Room
In the actual example, the scene built by Result Visualization Manager shows a room containing information about The Beatles. Inside the room (Figure 6), the users can see different objects representing the information related to The Beatles.
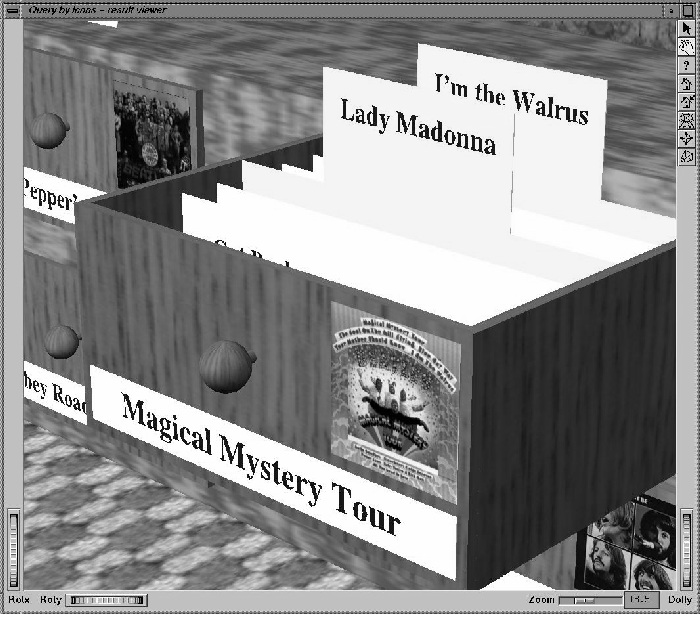
Figure 7: The Drawer Representing a CD of the Beatles
In particular, the name and the photo are represented as a poster located on a wall and the set_of CDs recorded by The Beatles as a drawer classifier. The user, by acting on a particular drawer with a pointing device, issues an EXPAND command. As a consequence, the songs contained in the selected CD, i.e., information at the lowest level of the query result, are displayed as different folders inside the drawer itself (see Figure 7).
This section deals with the issues that are mostly related with the user. Firstly, the User Model Manager (see Figure 1) is introduced. Then, the results of some preliminary usability studies are reported.
In the architecture of the proposed multiparadigmatic environment, shown in Figure 1, the User Model Manager handles the model of each user working with the system. Such a model is exploited by both the Query Formulation and the Result Visualization manager, and it is dynamically maintained according to the history of the interactions. The user model consists of three components, that will be briefly illustrated in the sequel: the class stereotype, the user signature and the system model. More detail on such components and on the algorithms that manage them can be found in [4].
A stereotype is "a collection of attributes that often co-occur in people" [20]. We adopted stereotypes for modeling different classes of database users (see [7]). Database users are first divided into two classes: professional and non-professional users, depending on the training they have had. The broad class of non-professional users is the one that will most benefit from a cooperative interaction with the database system. We therefore concentrated on the features of non-professional users, namely frequency of interaction, repetitiveness of the query, structural complexity of the query, and familiarity with the database content [7], whose values are taken into account for computing the database user stereotypes. We have also identified the types of visual representations most appropriate for each user stereotype [4]. As a consequence, once a user has been identified as belonging to a class characterized by a specific stereotype, the system can suggest the visual representation most appropriate for that stereotype. The first time the user interacts with the system, he or she is assumed to belong to the class having the lowest value for all four features, and the stereotype of this class actually constitutes his or her model. Then, the system keeps track of the set of queries the user formulates. From such a set of queries, the system can infer general characteristics of the requests typically formulated by each specific user, such as the kind of query pattern, the query complexity, etc. It is worth noting that we do not intend to keep all the history of the interaction, but a compressed history which is defined as the user signature.
As the interaction with the machine continues for a longer period of time, the user knows more and more about the system itself. Therefore, he or she creates his or her own model of the system organization, namely the system model. In our context, the system model is the representation of the knowledge the user has of the database structure and content. In the simplest case, the system model is the user's database view. The system model is used in order to reduce the cost of search operations, following the approach proposed in [11], i.e. to represent for each user the most frequently accessed portion of the database in a small and dynamic structure. By exploiting the system model, it is possible to suggest to the user the view of the database most appropriate for his or her expectations.
As it results from the above, our user model is a triple UM = <CS, US, SM&γτ;, where CS is the user class stereotype, US is the user signature and SM is the system model. The CS component is a feature vector. The US component holds typical query patterns, which are basically a set of subgraphs with associated weights to indicate interaction frequencies or user's preferences. The SM component is a subgraph of the Typed Graph representing the user view. This component is not commonly present in user models described by other researchers, since it is related to our domain of interest, namely database query processing.
It is widely believed that, in order to evaluate the usability of a system, it has to be tested against real users. Since we share such an opinion, we started quite early to run system trials, which are still on. We do not have yet complete results on the testing of the whole system, in particular on the switching mechanism. Thus, we report the preliminary studies we did in order to evaluate how different representations and interaction mechanisms are more appropriate with respect to both the user type, e.g. experts vs. novices, and the kind of query, e.g., selection vs. join queries.
In our experiments, we adopted two measures of usability, namely the accuracy of query completion (i.e., user's correctness rate when writing the queries) and the time spent to complete a query. They were evaluated quite precisely by directly observing real users executing predefined tasks (see [3, 9]). Such tasks were query writing and query reading, both of which are performed by investigating the relationships between database queries expressed in natural language and the same queries expressed in the system under study. The experiments aimed at comparing a diagram-based query language, against both a traditional text-based query language, namely SQL [15], and an icon-based query language. The experiments were designed to determine if there is a significant correlation between: 1) the query class and the query language type, and 2) the type of query language and the experience of the user. The subjects were undergraduate students, secretaries and professionals having different levels of expertise. The results of the comparison between the visual languages and SQL confirmed the intuitive feeling that a visual language is easier to understand and use than a traditional textual language not only for novice users, but also for expert ones [3, 9]. The experts' errors when using SQL were mainly due to the need of remembering table names and using a precise syntax. Working with a visual language, users can gain from looking at the diagrams and icons representing the database schema.
On the basis of the figures we got when comparing the two visual languages, we can say that expert users perform better using the diagrammatic system, while a small difference exists concerning the performance of non-expert users (slightly better using the iconic one). However, while considering the query classes, we discovered noticeable differences between both the class of queries containing cycles (i.e. containing twice the selection of the same concept), better performed in the iconic system, and the class of queries containing paths (corresponding to sequences of joins), better performed in the diagrammatic one. Such differences involve both time and accuracy and are totally independent from the skill of the users. In the second case, the difference could be due to the fact that paths are explicitly represented in the diagrams, while icons are sequentially displayed.
In this paper we presented a system for accessing databases expressed in different models through an adaptive interface exploiting several visual representations and interaction mechanisms for both expressing the query and visualizing the result. Depending on the stored user model, the system suggests the most appropriate interaction paradigm to the user, who has at any moment the possibility of switching to a different one. The system has been partially implemented and is still under development. First (partial) results on its usability gave encouraging results.
The group working on user interfaces at the Dipartimento di Informatica e Sistemistica (DIS) of the Università di Roma consists of Carlo Batini, Tiziana Catarci, Giuseppe Santucci, Antonio Massari, and Lorenzo Saladini, whose research topics include, among the others, Visual Formalisms and Visual Query Languages for Databases. The group has been involved in several EU Projects on visualization topics, and actively cooperates with various Universities and Research Institutes worldwide. Besides several publications in international journals and conferences, the DIS group has also implemented prototypes of visual interfaces for database access, such as QBD and QBI, which are currently being transformed into industrial products by an Italian software company.
The DIS interface group strictly cooperates with the Dipartimento di Informatica of the Università of Bari, namely with professor Maria Francesca Costabile, who is a member of the research group led by Floriana Esposito. Such a group works on different topics in the field of Artificial Intelligence, including Human-Computer Interaction and Visual Interfaces, on which Professor Costabile is personally involved. She is member of the Pictorial Computing Laboratory of the University of Rome "La Sapienza", directed by Stefano Levialdi, and recently cooperates with the Telemedia Laboratory of the University of Lecce, directed by Paolo Paolini. Finally, Maria Francesca Costabile and Stefano Levialdi, together with Tiziana Catarci and Giuseppe Santucci, have originated the ACM International Workshops on Advanced Visual Interfaces (AVI), whose third edition was in Gubbio, Italy, May 1996.
T. Catarci, A. Massari, L. Saladini & G. Santucci
Dipartimento di Informatica e Sistemistica, Università di Roma "La Sapienza" -- Via Salaria, 113, 00198 Roma, Italy
catarci@infokit.dis.uniroma1.it
massari@infokit.dis.uniroma1.it
saladini@infokit.dis.uniroma1.it
santucci@infokit.dis.uniroma1.it
M. F. Costabile
Dipartimento di Informatica, Università di Bari
Via Orabona 4 -- 70126 Bari, Italy
Issue |
Article |
Vol.28 No.3, July 1996 |
Article |
Issue |